Data analysis is a very technical process. First we start out with a question, and we search for a way to answer that question by gathering data. We then observe that data and analyze whether or not we have found our answer. We always hope to find the answer, but often times with research; the answers are not always there… so we start again! Data research is an endless cycle, but when we finally do get to that ‘ah ha!’ moment, we rejoice
When we are faced with a project that handles big data, the three main elements to the process are data collection, data reporting, and data analysis. These are all essential efforts in order to find the output we are striving for. However, there is one element that tends to be less emphasized as a major part in the data collection process, and that is data presentation.
In order to build superb credibility, data must be presented as effectively as possible. Presenting data is a way to demonstrate to the audience how we are going to accomplish the goal at hand. The presentation should be swift and simple, with easy to understand modules.
1. Sloppiness will be the demise of your brand
- The people in the room will know a lot less about the data than you will, their first impression, and often the lasting impression, might be how clean your data presentation was.
2. Simplify the data
- If there are data comparisons among multiple sources, do the math yourself. Don’t expect the audience to study the data, and then do the comparing and contrasting themselves. They will quickly lose interest and patience. Point out the critical values, and then discuss the implications.

3. Make the data your focal point
- Avoid using arrows, and pictures, and broad titles when presenting the data. These are only distractions, and they scale down the emphasis on the output. Have a clear graph, with a clear title. The audience does not need extra explanations to look at; you are the presenter, this is your job.
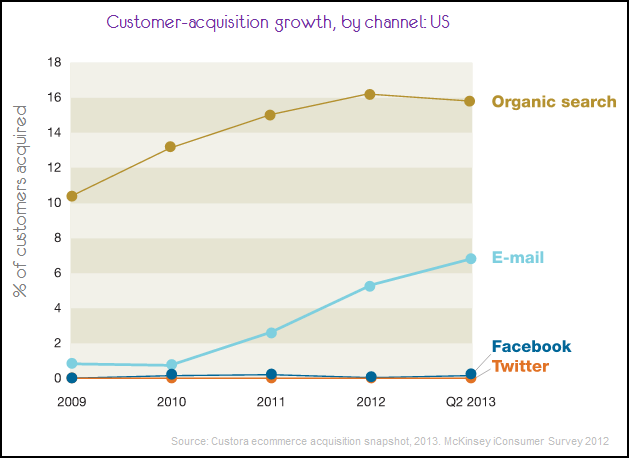
4. Line charts, and bar charts, and pie charts… oh my!
- Choose the most appropriate chart to display your data.
- Line graph: use when tracking changes over a period of time.
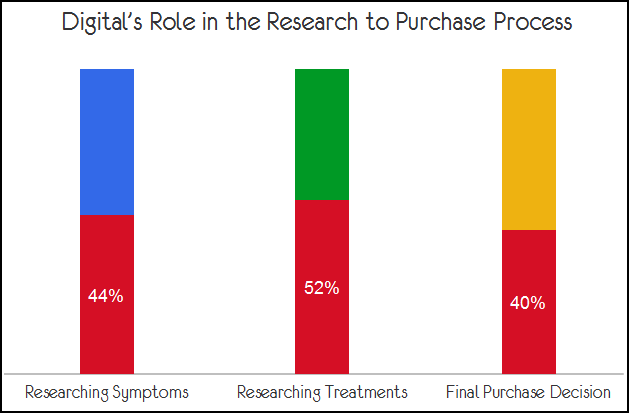
- Pie chart: use when comparing parts of a whole.
- Bar graph: use when comparing things between different groups.
- X-Y chart: use when comparing the relationship between two different things.
By following these simple data presenting metrics, you will deliver your results clearly and concisely. The audience will be able to keep up with your explanations with the easy to understand graphs. Remember, your data presentation is only a small part of the presentation as a whole. Once you have explained the results, move on to what these findings imply for the company as whole.
Search
Tags
Latest Blog Posts
- ChatGPT Atlas: Meet the Browser That Brings AI to Every Tab
- What Pittsburgh Businesses Can Learn from the New Pittsburgh Airport Terminal
- Generative Engine Optimization: Strategies to Win in AI
Rss

Rss Archive